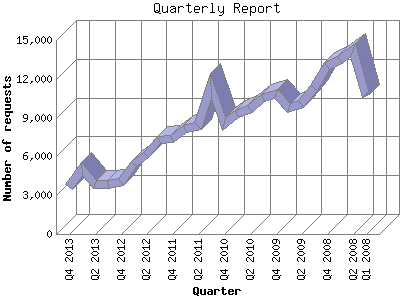
The Quarterly Report shows total activity on your site for each quarter of a
year. Remember that each page hit can result in several server requests as the
images for each page are loaded.
Note: Most likely, the first and
last quarters will not represent a complete quarter's worth of data, resulting
in lower hits.
| Quarter | Number of requests | Number of page requests | |
|---|---|---|---|
| 1. | Q1 2008 | 10,681 | 2,750 |
| 2. | Q2 2008 | 14,189 | 4,361 |
| 3. | Q3 2008 | 13,466 | 4,084 |
| 4. | Q4 2008 | 13,007 | 4,709 |
| 5. | Q1 2009 | 11,271 | 4,112 |
| 6. | Q2 2009 | 10,080 | 3,795 |
| 7. | Q3 2009 | 9,762 | 3,520 |
| 8. | Q4 2009 | 10,808 | 3,796 |
| 9. | Q1 2010 | 10,481 | 4,043 |
| 10. | Q2 2010 | 9,689 | 3,972 |
| 11. | Q3 2010 | 9,249 | 3,842 |
| 12. | Q4 2010 | 8,523 | 3,537 |
| 13. | Q1 2011 | 11,433 | 5,919 |
| 14. | Q2 2011 | 8,384 | 4,980 |
| 15. | Q3 2011 | 8,120 | 5,132 |
| 16. | Q4 2011 | 7,382 | 4,718 |
| 17. | Q1 2012 | 7,234 | 4,177 |
| 18. | Q2 2012 | 6,085 | 4,618 |
| 19. | Q3 2012 | 5,418 | 4,145 |
| 20. | Q4 2012 | 3,986 | 3,663 |
| 21. | Q1 2013 | 3,828 | 3,499 |
| 22. | Q2 2013 | 3,879 | 3,457 |
| 23. | Q3 2013 | 4,991 | 4,306 |
| 24. | Q4 2013 | 3,612 | 3,128 |
Most active quarter Q1 2011 : 5,919 pages sent. 14,189 requests handled.
Quarterly average: 4,094 pages sent. 8,564 requests handled.
This report was generated on December 11, 2013 11:55.
Report time frame January 21, 2008 01:04 to December 10, 2013 23:14.
| Web statistics report produced by: analog 6.0 / Report Magic 2.21 |